Skip to content

EEN web application UX

Context

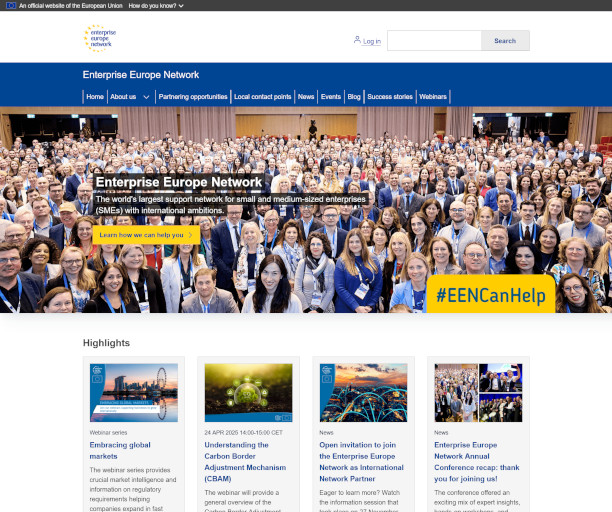
The Enterprise Europe Network (EEN) is the world’s largest support network for small and medium-sized enterprises (SMEs) with international ambitions. Its members include chambers of commerce and industry, regional development organisations, universities, research institutes, and innovation agencies.
EEN’s mission is “to provide high-quality support to European innovators, researchers, businesses, and consumers […], to reinforce the European Union’s position as a global leader in Research and Innovation, strengthen its Single Market, open up opportunities for SMEs, and maintain high standards of protection for its citizens — all towards a more competitive, digital, green, and inclusive EU.”

Its vision is to enable European innovation to thrive and expand globally.

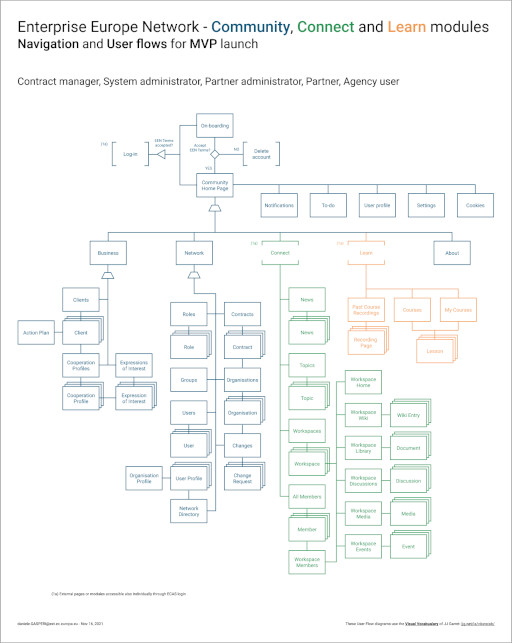
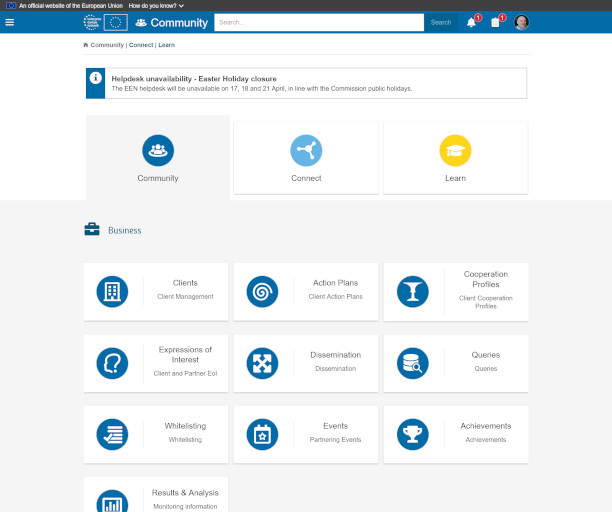
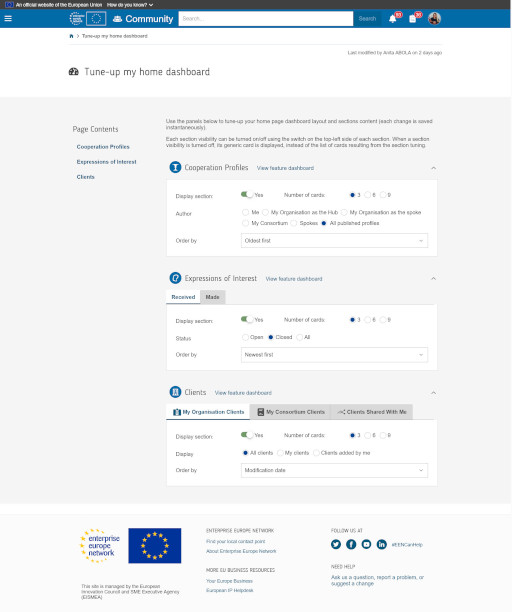
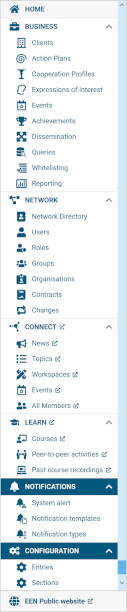
From 2019 to 2025, I was contracted as an external UX consultant via Cegeka, joining a 14-person IT team to design the user experience of EEN’s core business platform — the new Community (NextEEN) web application. In parallel, I led the UX design for other digital tools in the ecosystem, including:

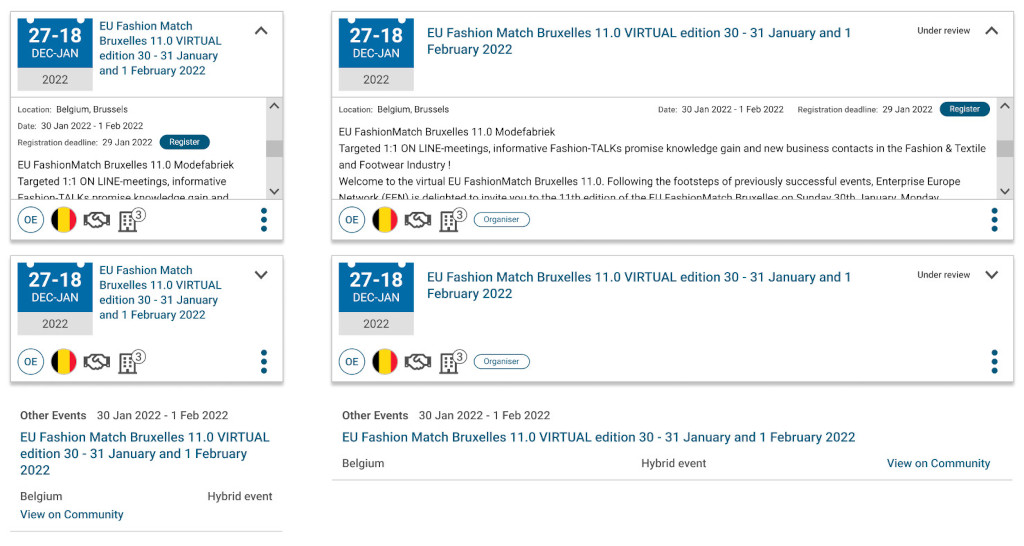
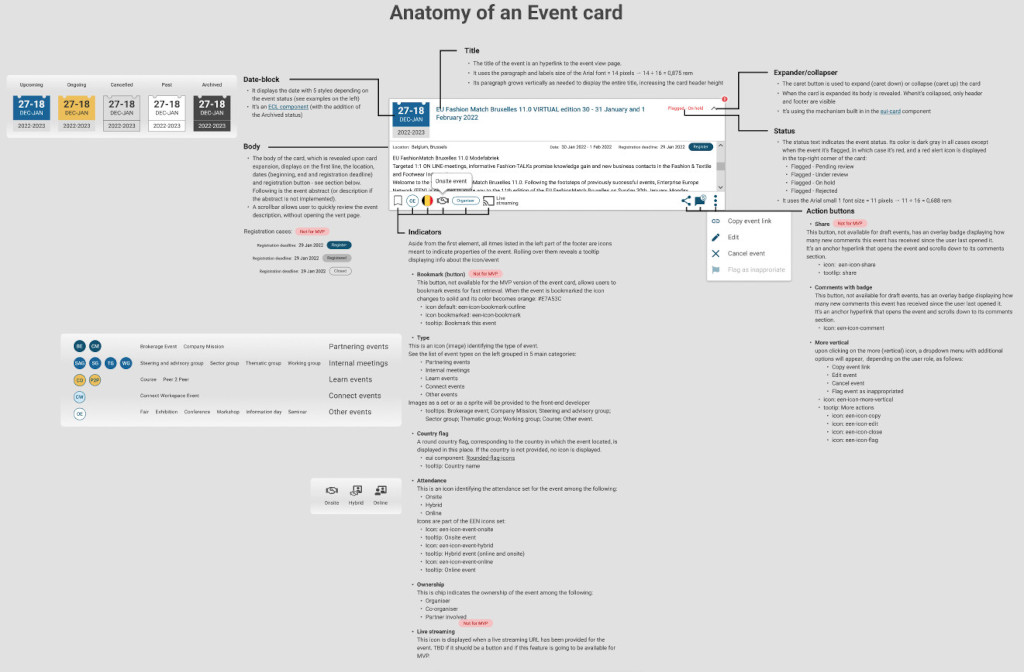
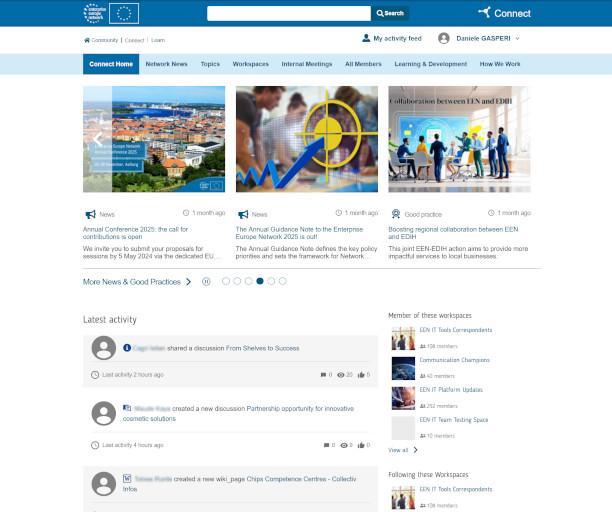
  • Connect (events and forums)
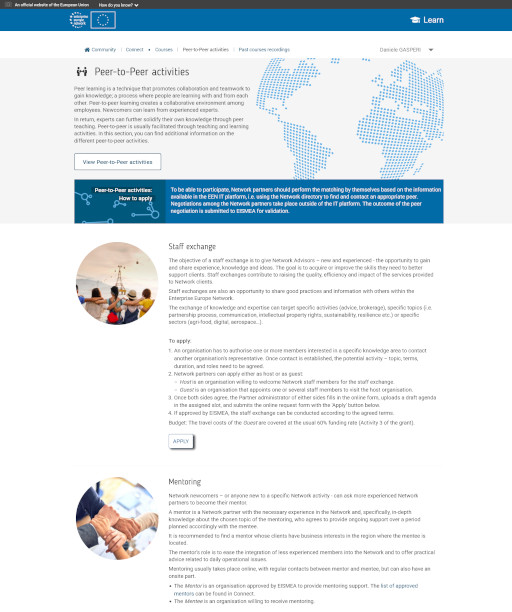
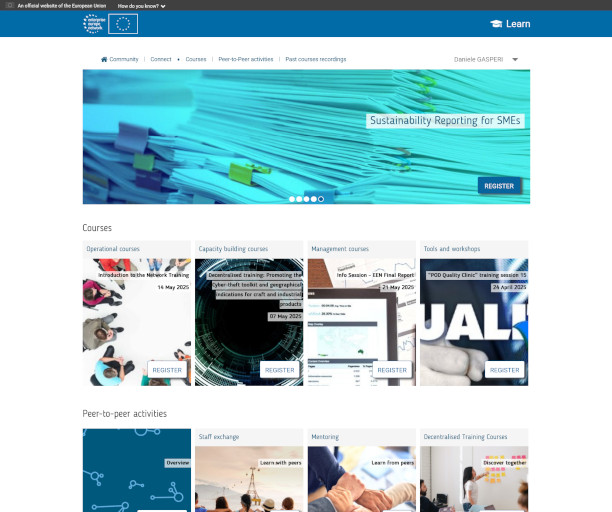
  • Learn (e-learning)
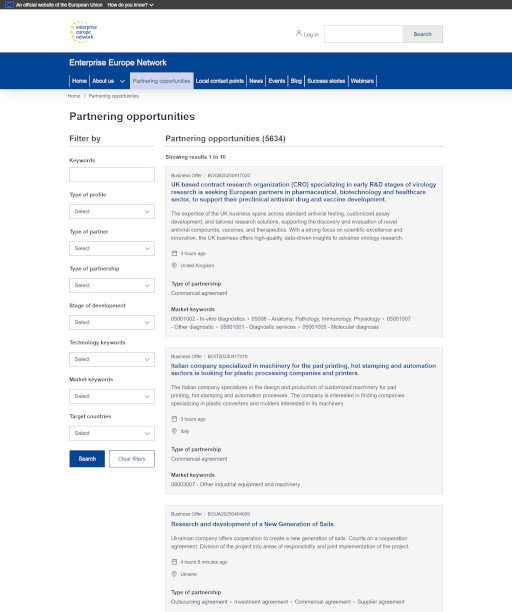
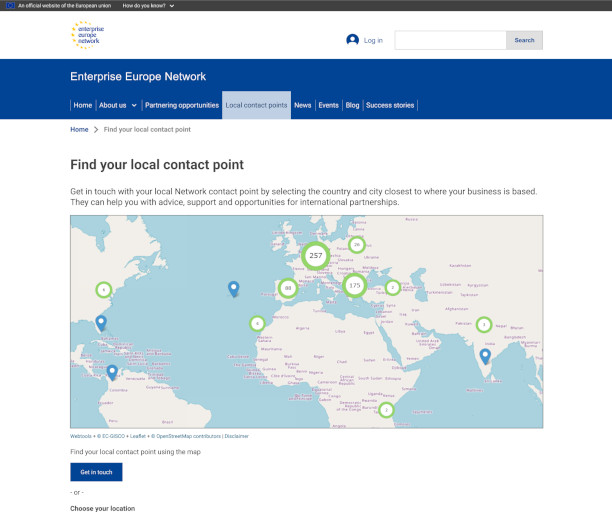
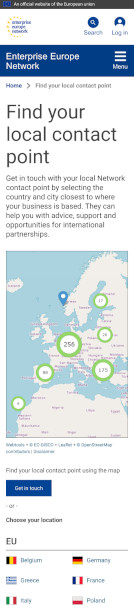
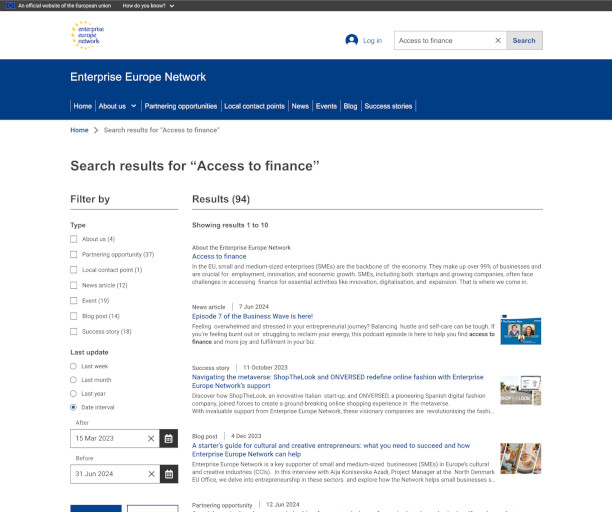
  • The EEN public website

Challenge

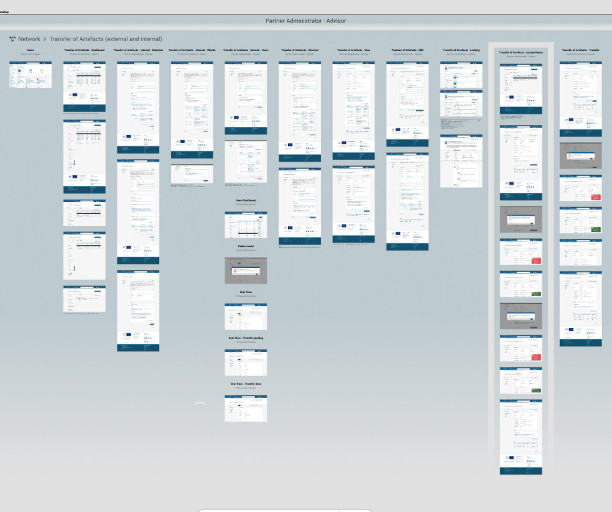
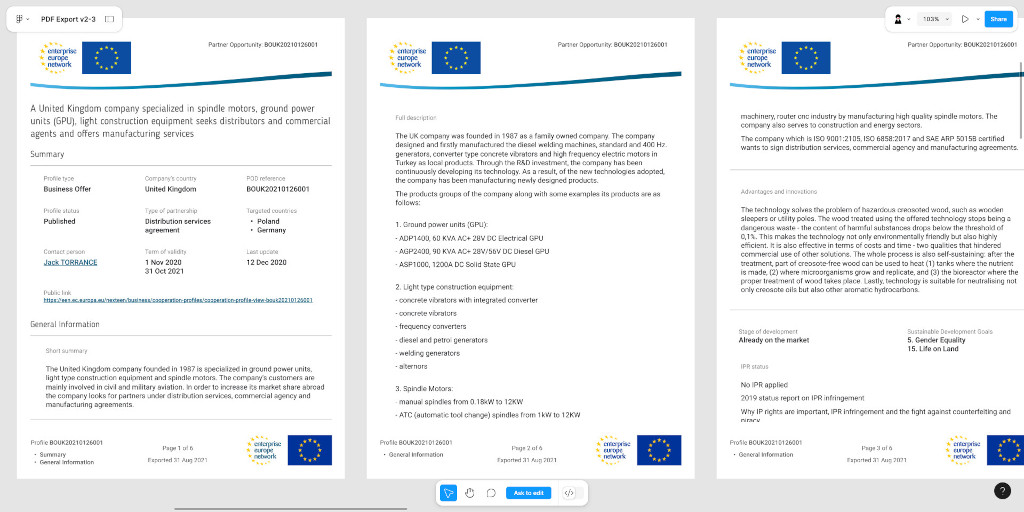
The new Community application, developed in .NET, needed to replicate and improve upon the functionalities of the legacy Drupal platform while enabling deeper customization. Key challenges included:

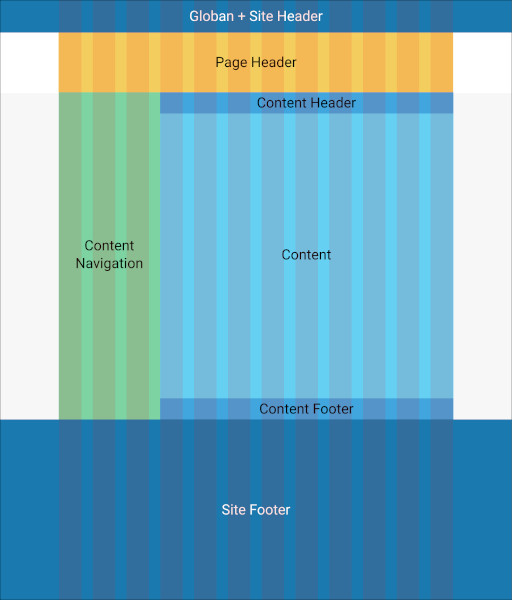
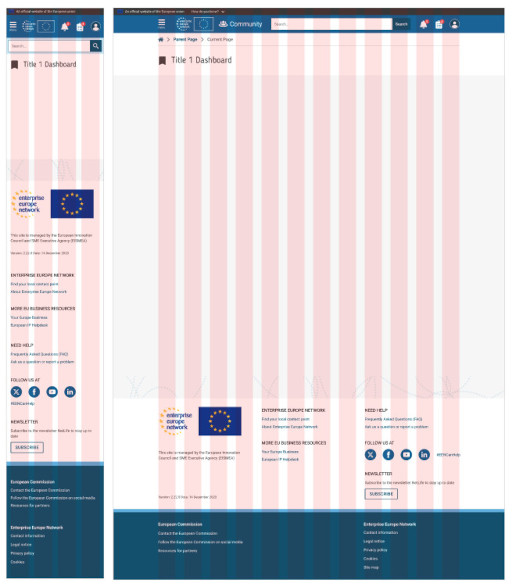
  • The front end had to comply with a new UI framework (eUI) developed by the European Commission. Early versions of eUI offered a limited set of components, posing constraints on UX design.
  • Requirements were defined by seven Business Managers from different departments of the European Commission EISMEA agency, who often had conflicting visions and priorities for the product.
  • A newly issued standard (Europa Web Guide) was not known by key stakeholders, and many requested features were unsupported due to resource limitations.
  • While the initial project manager valued UX contributions, the following three diminished UX’s role, altering the product roadmap.
  • After the first six months, the COVID-19 pandemic forced the entire team to shift to fully remote work, requiring a redefinition of our collaboration practices.
Flowchart outlining navigation and user roles in the Enterprise Europe Network's Community, Connect, and Learn modules for MVP launch.
Navigation and user roles in the Community, Connect, and Learn modules for MVP launch.
A website layout diagram with labeled sections: Global + Site Header, Page Header, Content Header, Content Navigation, Content, Content Footer, and Site Footer.
Layout of the Community web application
A website dashboard wireframe is shown in desktop and mobile views, with visible content sections, navigation bars, and a red grid overlay for layout alignment.
Community layout for mobile and desktop
Form for saving partnering opportunities as a query, with fields for name, description, target, recipient, frequency, and next execution date.
Community – Save as a query modal
Community cooperation profiles, filtered by organization type, partnership type, and other criteria, showing results for various businesses and projects.
Community – Cooperation Profiles dashboard
Screenshot of the Enterprise Europe Network website displaying various partnering opportunities in research and technology sectors.
Partnering opportunities page of the EEN public website
Screenshot of a network directory with filters for searching organizations by various criteria like country, expertise, and city.
Cummunity – Network Directory
Network Directory Profile page of a professional from the Foreign Trade Department, showcasing contact info, expertise, and organization details.
Cummunity – Network Directory – User profile
Multiple website interface wireframes for the administrator role.
Transfer of artefacts wireframes
Illustration of a peer-to-peer networking webpage, featuring staff exchange and mentoring activities with diverse participants engaged collaboratively.
Learn – Peer-to-peer activities section home
Wireframe for desktop with map displaying local contact points across Europe for the Enterprise Europe Network, aiding businesses in seeking international partnerships.
EEN public website desktop wireframe
Wireframe for mobile with map displaying local contact points across Europe for the Enterprise Europe Network, aiding businesses in seeking international partnerships.
EEN public website mobile wireframe

Process

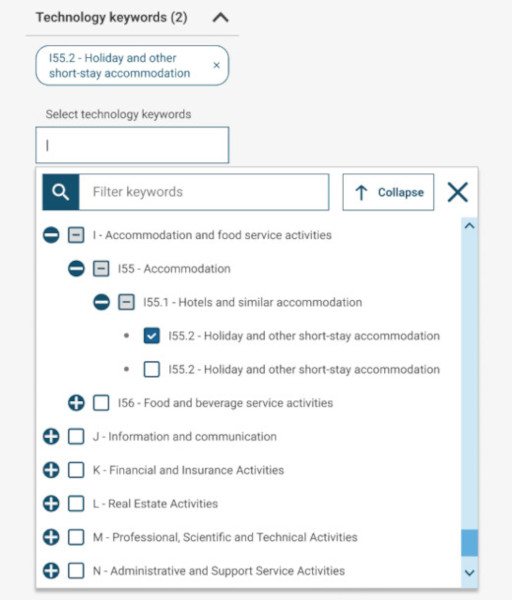
The project began with an in-depth review of the legacy platform and early deliverables from previous teams. I actively participated in requirement gathering through workshops, interviews, and focus groups.
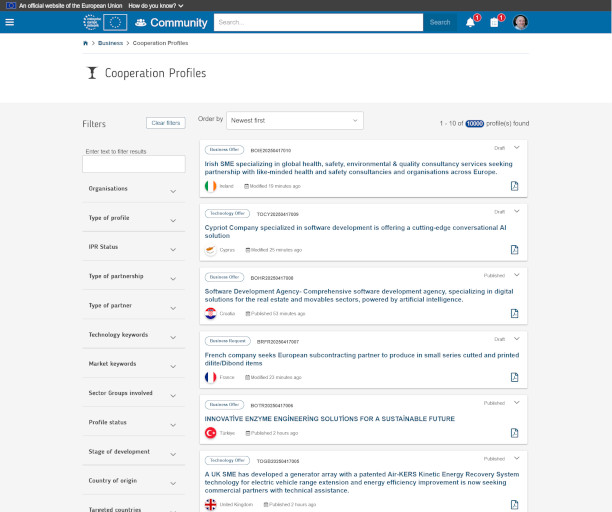
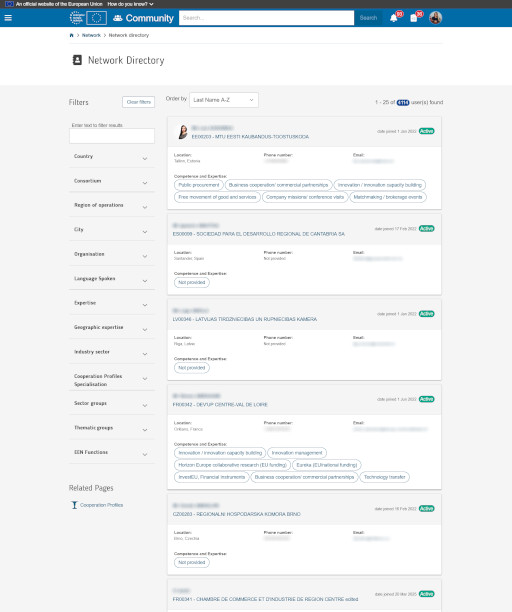
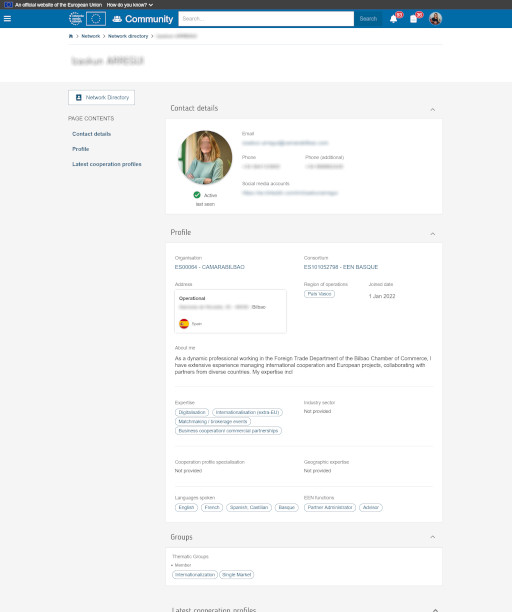
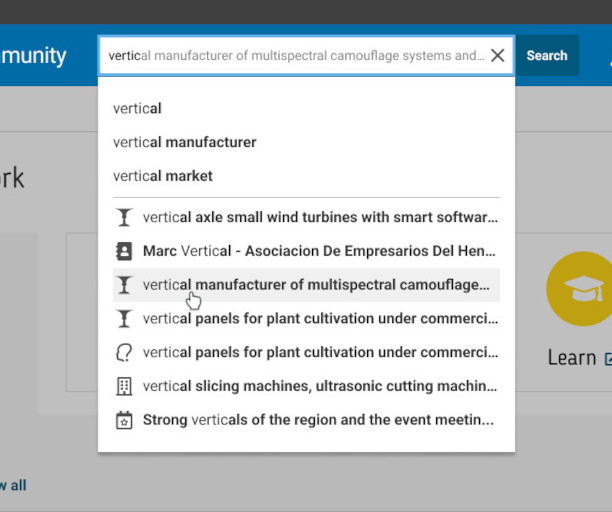
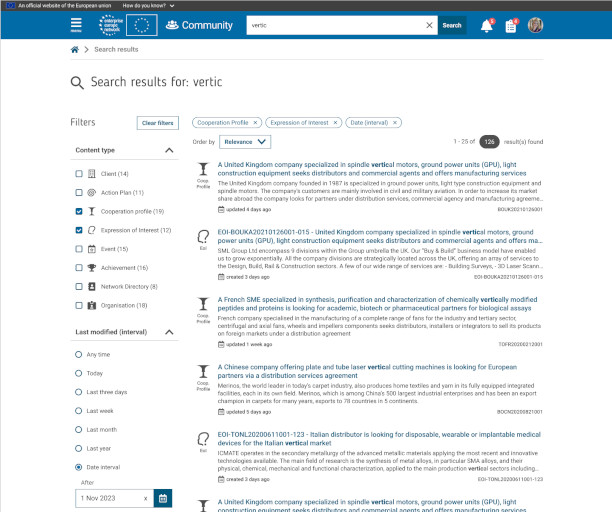
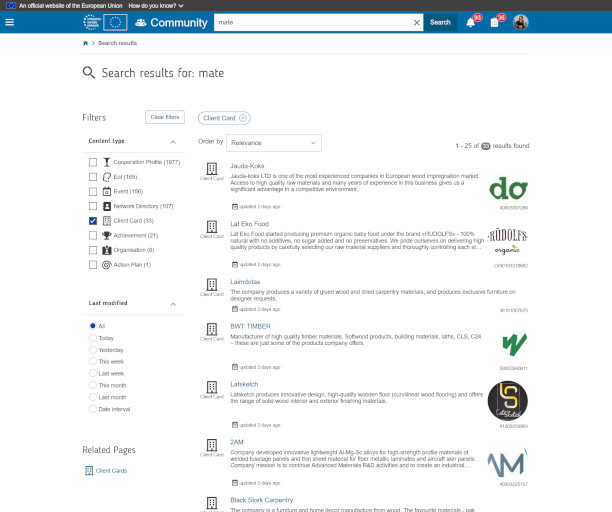
From there, I took responsibility for the search functionality, before moving on to the full redesign of all core features across the Community platform and enhancements to the other web applications.
My design process followed a structured UX methodology:

  • Requirement analysis (in collaboration with the Business Analyst)
  • User flow design
  • Wireframe creation
  • Internal reviews with front-end and back-end developers
  • Iterative feedback loops with Business Managers
  • Testing and refinement through development cycles, before and after deployment
Design of six variations of the Event card component collapsed and expanded with sample info of the EU Fashion Match Bruxelles 11.0 virtual event, January 30-February 1, 2022, in Belgium.
Figma library – Wireframe of the Event card component collapsed and expanded, for mobile and desktop
A detailed infographic titled "Anatomy of an Event Card" explains various components of an event card. Several sections, like Date-block, Body, Indicators, and Action buttons, describe functionalities such as title, status, and actions like editing or canceling. Visual icons indicate different event types and indicators. Overall, the design conveys a structured and informative layout for understanding event management components.
Figma – Wireframe of the anatomy of an Event card
Web page with list events, December 2023 to April 2025, filtered by date, type, and country.
Community Event dashboard implementation
Icons for "Cooperation Profiles," "Expressions of Interest," and "Action Plans" with a goblet, a head silhouette, and a spiral, respectively. Simple design and organized layout.
Some of the icons of the EEN font set comprising 196 icons
Pie chart showing customer priorities for improving online experience of the European Commission website; ease-of-use (62%), social media (23%), and content (15%) are top priorities, with search (12%) ranking second in the Ease-of-use section
Analysis and UX Design of the Search UI – Documentation
Search bar interface displaying autocomplete suggestions for the query "vertical manufacturer of multispectral camouflage systems and...". The dropdown list includes related search terms such as "vertical manufacturer", "vertical market", and "vertical axle small wind turbines with smart software". A cursor hovers over the suggestion "vertical manufacturer of multispectral camouflage...". The search is conducted on a website with a blue navigation bar and a partially visible "Learn" icon featuring a graduation cap. This image illustrates user search behavior, keyword input, and predictive text features on a professional or technical platform.
Search auto-complete and auto-suggest UI patterns in a wireframe
Search results wireframe showing listings for Cooperation Profiles and Expression of interest filters
Search Engine Results Page (SERP) wireframe for Community
Search results implementation showing listings for Client filter
Search Engine Results Page (SERP) implementation for Community
Search results wireframe showing listings for "Access to finance" entered text
Search Engine Results Page (SERP) wireframe for the public website
Dropdown menu interface for selecting technology keywords on a business classification platform, showing the expanded category tree under "I - Accommodation and food service activities". Subcategories include "I55 - Accommodation", "I55.1 - Hotels and similar accommodation", and two instances of "I55.2 - Holiday and other short-stay accommodation", one of which is selected. Additional collapsed categories include "I56 - Food and beverage service activities", "J - Information and communication", "K - Financial and Insurance Activities", "L - Real Estate Activities", "M - Professional, Scientific and Technical Activities", and "N - Administrative and Support Service Activities". A search bar labeled "Filter keywords" is also visible. This image highlights taxonomy selection, hierarchical keyword filtering, and classification tagging in a digital interface.
Wireframe of the Community dashboard Technology filter, using a eUI check-boxes tree selector
Dashboard interface of the Enterprise Europe Network (EEN) website showing key performance indicators, statistics, and visual analytics for business support services. Metrics include the number of countries (107), organizations (593), network staff (3.9K), partnership agreements (29.59K), and achievements (38.86K). Visual elements include a world map with bubble chart indicating organizations and achievements by country, a bar chart of top countries by achievements, and a line graph showing monthly evolution of achievements. The interface includes navigation tabs like "EEN key figures", "Achievements", and "Consortium overview". European Commission and Enterprise Europe Network logos appear at the bottom.
Community Results and Analysis section – EEN Key figures tab

Additional ongoing activities included:

  • Web analytics review
  • Bug and ticket triage
  • Usability testing
  • User interviews and surveys
  • Regular coordination with the IT Team, Business Team, and user representatives

Results

Webpage displaying community portal with navigation icons for Community, Connect, and Learn. A notification highlights Easter holiday closure. Business section features icons for Clients, Action Plans, and more, conveying an organized, professional tone.
Community homepage – European Commission Agent user
Community web platform interface with sections titled "Community," "Connect," and "Learn." It displays business cooperation profiles and expressions of interest in a structured layout.
Community homepage – Organisation user
Dashboard settings page showing cooperation profiles, expressions of interest, and clients. Includes options to customize views and sorting preferences.
Community homepage – tune-up page
A website interface features tabs for news, network events, workspaces, and more. Three main news articles display images and headlines. The layout is clean, with sections for latest activities and workspace memberships on the side. The tone is professional and informative.
Connect homepage
Website homepage showcasing courses on sustainability and management for SMEs. Features images of documents, people in meetings, and training sessions. A blue and white color scheme conveys a professional tone.
Learn homepage
A large group of diverse people smile on the Enterprise Europe Network homepage. Text highlights SME support and a #EENCanHelp sign; a professional and welcoming atmosphere.
Public website homepage
Three-page document from the Enterprise Europe Network about a UK company's manufacturing services. It lists products like spindle motors and GPUs, and mentions sustainable practices. A header with EU and network logos is present on each page.
Wireframe of a Partnering Opportunity exported as PDF
Newsletter with EU and Enterprise Europe Network logos. Headline "Positive Network" above a hand touching a digital interface. Sections include "News," "Agenda," and features on Singapore and network personnel. Tone is professional and informative.
NetLife newsletter – February 2024
Vertical navigation menu featuring categories: Home, Business, Network, Connect, Learn, Notifications, and Configuration with various sub-options.
Community main menu – expanded

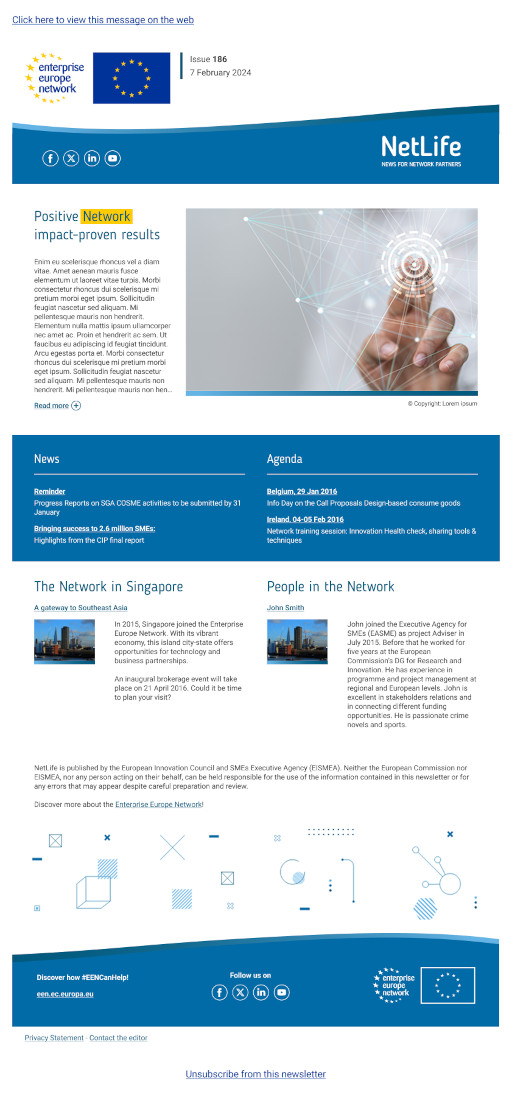
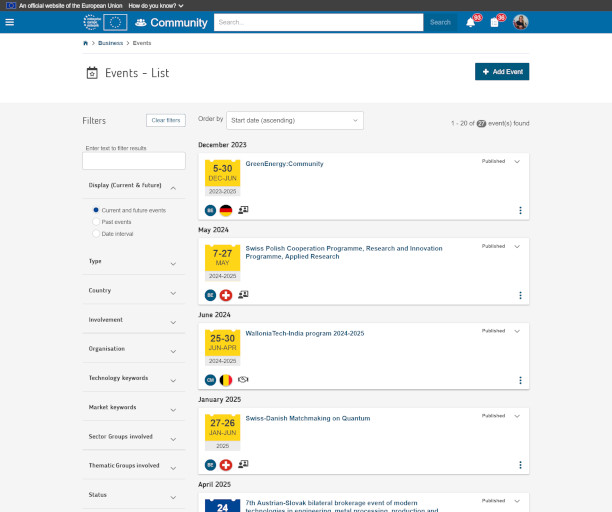
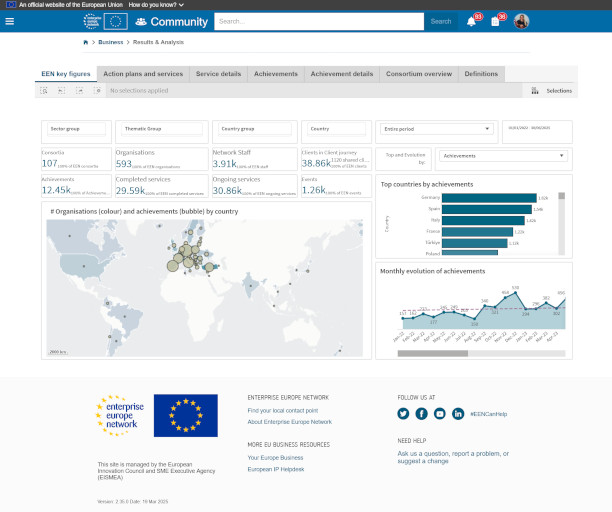
Despite the challenges of remote work, our team adapted quickly, maintaining strong collaboration and focus. In January 2022, the first public release of the new Community platform went live. Updates followed for Learn, Connect, and key areas of the public EEN website.
By December 2024, the impact was measurable:

  • +26% in the number of organisations joining the network
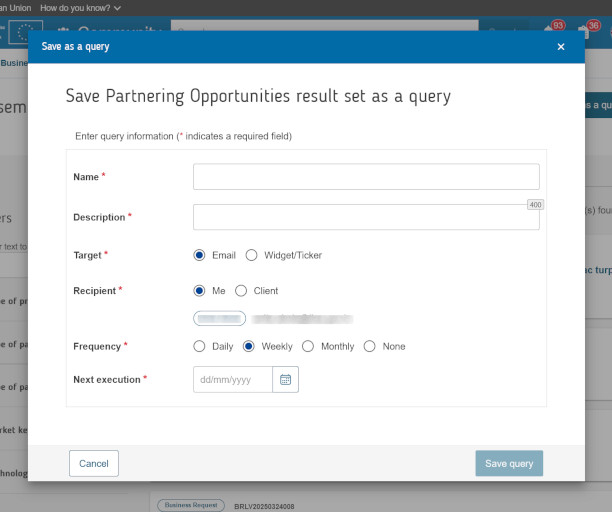
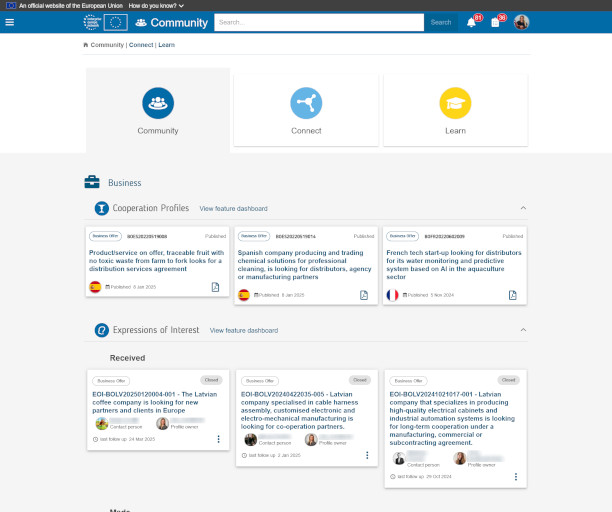
  • +17% increase in Partnering Opportunities published via the Community platform
  • +159% increase in Expressions of Interest for published opportunities
  • +39% increase in recorded Achievements by organisations using the Community application

Top